In this post, we explore the Out of Box performance of MongoDB on AWS Graviton2-based Amazon EC2 R6g instances. We show how the R6g instance achieves up to 117% higher throughput than the Intel Xeon-based R5 instance. The R6g instance also costs 20% less than the R5 instance, giving AWS Graviton2 a significant performance-per-dollar advantage over Xeon for running MongoDB.
Arm-based AWS Graviton2
AWS Graviton2 is a custom processor built by Annapurna Labs that is based on the Arm Neoverse N1 core. There are various EC2 instance types that are based off the Graviton2. These include the general purpose M6g, M6gd and T4g, the compute optimized C6g, C6gd and C6gn, and the memory optimized R6g, R6gd and X2gd instances.
MongoDB
MongoDB is a NoSQL database first released in 2009. Since then, MongoDB has gained wide adoption across various organizations and industries.
Arm-specific updates to MongoDB
Over the last couple of years, there have been updates to the MongoDB code base to optimize for Arm. For example, better support for AArch64 (a.k.a arm64), improved instruction cache handling, and the replacement of the Arm yield instruction with the ISB instruction (Instruction Synchronization Barrier). This motivated us to look at the performance of MongoDB on the Graviton2.
Test setup & methodology
Setup
Each test executed consisted of one load generator instance and one instance under test. The load generator ran YCSB to generate the load. Replication was not used because we are testing a single instance of MongoDB. At the time of testing, some of the Arm-specific changes were not in the latest release of MongoDB. For this reason, we tested tag v5.0.0-alpha0-179-g3c818a3 compiled with GCC 10.3. The following table shows the instances that were tested.
| R6g | R5 | |
| Size (vCPU) | 16xlarge (64) | 16xlarge (64) |
| Memory (GiB) | 512 | 512 |
| Network (Gbps) | 25 | 20 |
| AMI | Ubuntu 20.04 (ami-00d1ab6b335f217cf) | Ubuntu 20.04 (ami-09e67e426f25ce0d7) |
| Cost ($/hr) | 3.2256 | 4.032 |
The following table describes the load generator we used.
| R5 | |
| Size (vCPU) | 16xlarge (64) |
| YCSB version | v0.17.0 |
| YCSB client threads | 96 |
| AMI | Ubuntu 20.04 (ami-09e67e426f25ce0d7) |
The number of client threads was determined experimentally. Starting from 1, we increased the number of threads until the 99th percentile latency started to increase and the throughput started to decrease. We settled on 96 threads because it appeared to be the inflection point where performance started to degrade.
Methodology
We tested INSERT, RMW, and UPDATE operations with YCSB workload F. For each operation tested, we plot two graphs. The first graph shows target throughput versus actual throughput. Targeted throughput is the transaction rate in operations per second (ops/s) issued by the load generator. Actual throughput measures the ops/s the instance was able to sustain based on the target throughput load. This graph allows us to see where throughput saturates for each instance, compare to the ideal scaling, and make a comparison between instances before and after throughput saturation. The second graph plots target throughput versus latency (99 percentile). We plot the latency graph with target throughput instead of actual throughput for legibility purposes, as the graph becomes extremely skewed once we cross the throughput saturation point. We can still draw meaning from the target throughput versus latency graph as long as we are mindful of where throughput saturation occurs. We explore these test results in the next section.
Key findings
MongoDB INSERT results
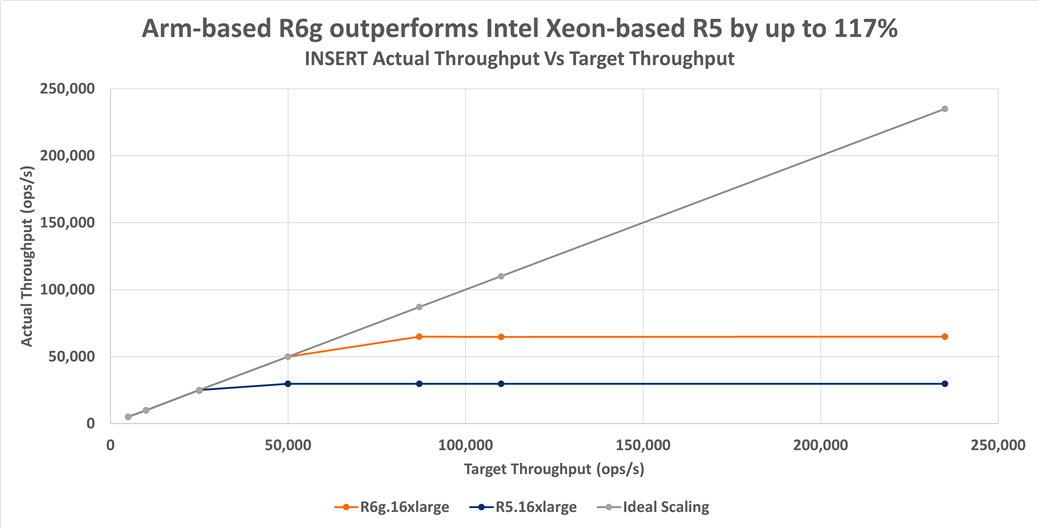
The left-hand side of figure 1 represents a low load scenario. Here we see for both R6g and R5 that actual throughput is about equal. We can also see that actual throughput tracks the target throughput (that is, ideal scaling) closely. However, as we increase load (move towards the right) we encounter saturation points for each instance type. The R6g saturates at approximately 64.8k ops/s, and the R5 saturates at approximately 29.8k ops/s. Thus, at high load the R6g offers about 117% higher throughput than the R5. Next, let us look at the latency graph associated with the throughput data previously shown.
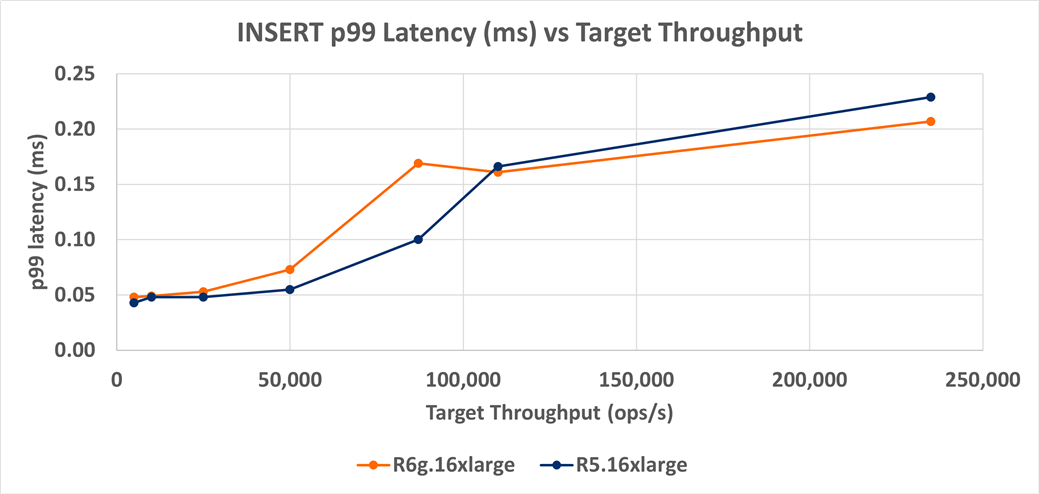
On average, the R6g has about 16% higher latency than the R5, but it also has 3% to 9% lower latency when the target load is high (110,000+ ops/s). This indicates that there could be significant run to run variation concerning latency. This would require repeatability testing because it is unclear if these sub 1ms p99 latency differences are significant. In any case, when looking at the latency graph, we also have to keep in mind the R6g has up to 117% higher throughput and 20% lower cost than the R5. Given these significant advantages, the 16% higher average latency looks like an acceptable trade-off.
MongoDB RMW and UPDATE results
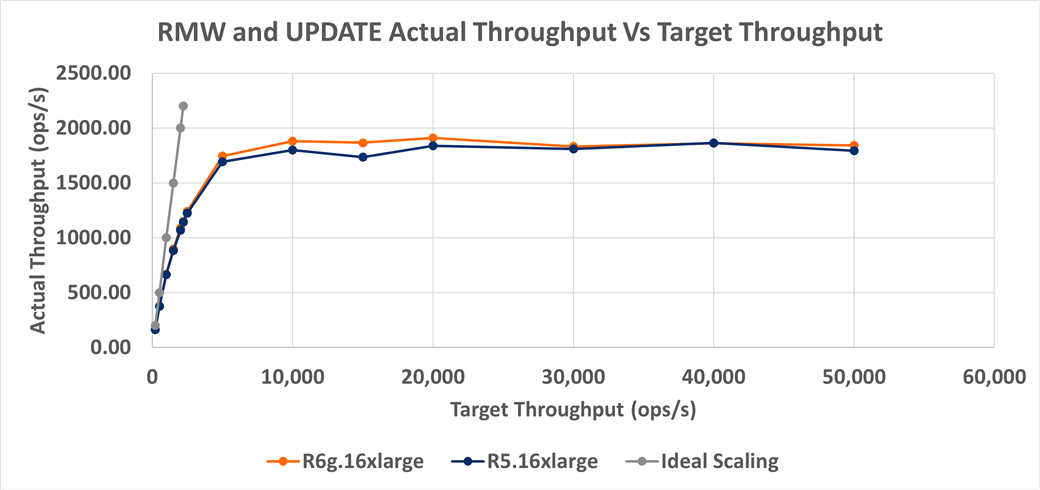
The first thing we notice on figure 3 is that both the R6g and R5 do not track well to the target throughput (ideal scaling). Even at the lowest target throughput of 200 ops/s, both the R6g and R5 are about 17% lower than the target throughput. The R6g and R5 results are similar up to 50,000 ops/s with R6g showing a modest 2% higher throughput than R5. Note, we include both RMW and UPDATE actual throughput in figure 3 as the test results are identical.
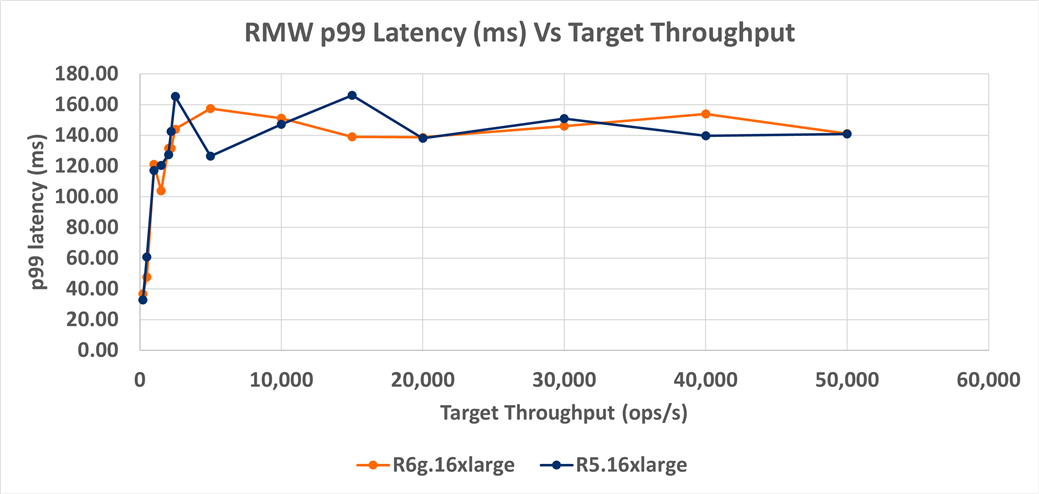
On MongoDB RMW the R6g and R5 p99 latency track each other closely. There is about 1.3% lower latency than the R5. As with INSERT, it is probably a good idea to do a repeatability analysis on the p99 latency. Overall, the R6g has a marginal throughput advantage over the R5 for RMW.
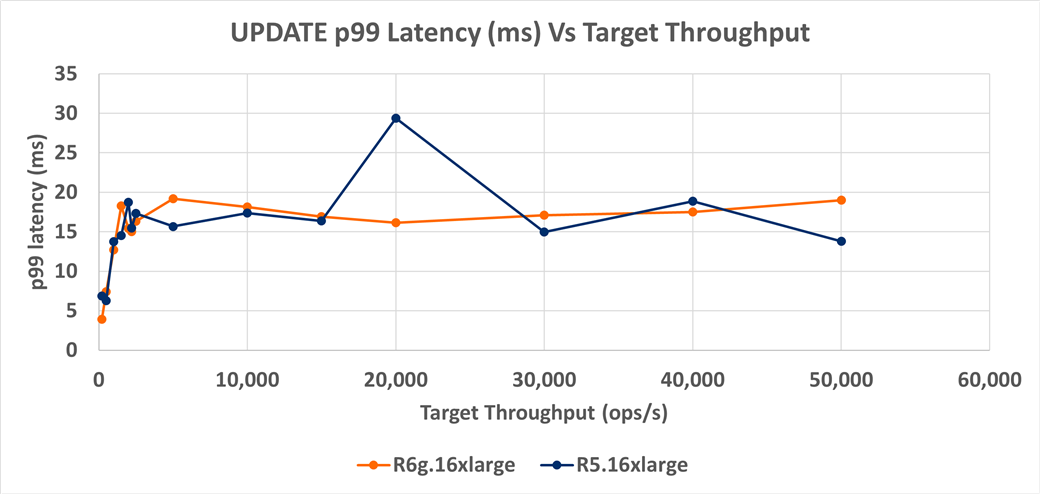
Figure 5: MongoDB UPDATE p99 latency (milliseconds) versus target throughput for Arm-based R6g instances versus Intel Xeon-based R5 instances.
On average, UPDATE p99 latency between R6g and R5 are very similar, so we should consider latency between the two instances equal. Like with the other operation types, a repeatability analysis should be done on the p99 latency.
[“source=community”]
